In the Heart of the Sea Image Credit: Adapted from "In the Heart of the Sea", credit Warner Bros. Pictures
In the Heart of the Sea Image Credit: Adapted from "In the Heart of the Sea", credit Warner Bros. Pictures
In previous articles in this series, we've looked at how we think black holes have formed, where they are, and how old they are. Now, let's look at how big they are.
How Big?
[...] such a whale will weigh at least ninety tons; so that, reckoning thirteen men to a ton, he would considerably outweigh the combined population of a whole village of one thousand one hundred inhabitants.
As I mentioned earlier, not all black holes are the same size, and different sizes of black holes may have formed in different ways. To organize what we know about the different sizes of black holes, astronomers categorize them by mass, into what you might think of as different weight classes. The largest are the supermassive black holes we’ve been talking about here, which have masses of millions to billions of times that of our Sun. There are also the stellar-mass black holes with which I began this article, and perhaps even the primordial black holes I mentioned, with masses less than that of a star. But all of those classifications beg the question: how do we know how “massive” a black hole is in the first place?
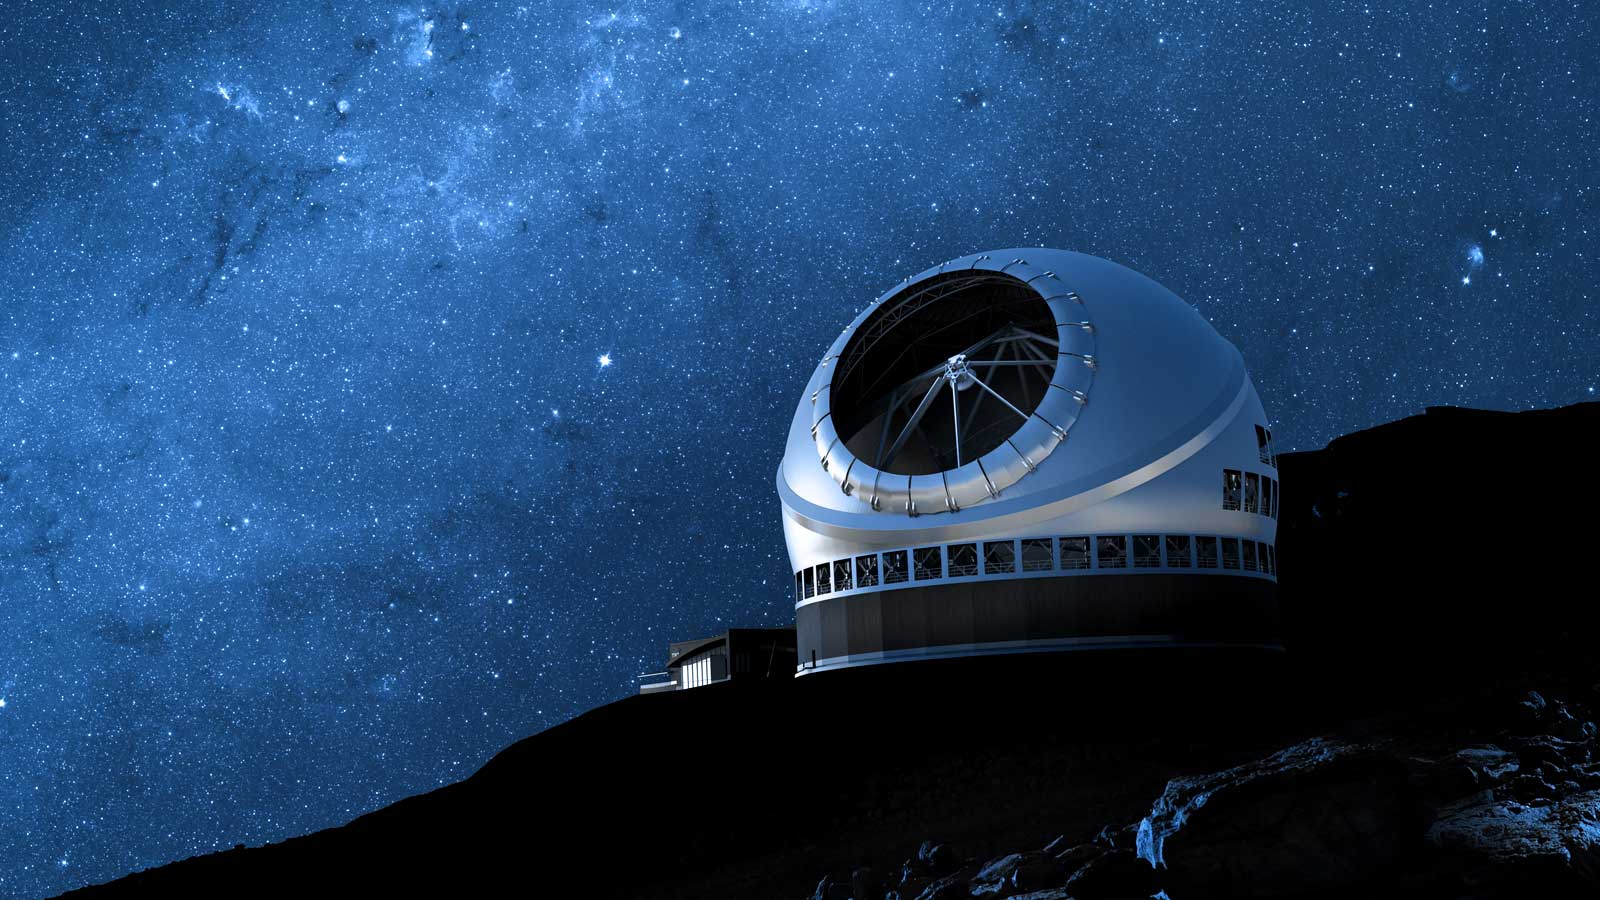
We actually have a few different ways to figure out the mass of a black hole, but all of the ways we use are evolving and being refined (and helping to advance the science in this area is one of TMT’s missions). Here, I’ll cover just two of them. As you’ll see, with these methods, once again, we measure what we can, and then use what we know about gravity to figure out the rest.
Why gravity? Notwithstanding the differences among the various sizes of black holes, they all have one thing common: they come into being through, and are characterized by, gravitational attraction. The extreme gravitation that creates and characterizes a black hole also makes it even stranger than you might imagine. We've described a black hole as an object, and so it is, but not like any other object we're familiar with here on Earth. Just as Moby Dick was singular among whales, black holes are singular too. In fact, black holes are thought to contain something called a "singularity," which takes up no physical space whatsoever. The question whether a singularity is physically possible led some scientists of the last century to doubt black holes existed at all.
Outside the singularity, there is a physical size we can measure: that of the event horizon. We define the event horizon as being the “surface” of the black hole, inside of which we can’t see anything, because once inside the event horizon, light can’t escape and neither can anything else. The event horizon of the supermassive black hole at the center of our own Milky Way is a few million kilometers in diameter.
Let’s talk first about the approach scientists used to deduce the mass of the supermassive black hole at the center of the Milky Way, which in this example I’ll call Moby. (For sticklers: scientists actually call the radio source coinciding with that black hole Sagittarius A*.) After that, I’ll cover one of the ways scientists are trying to “weigh” other galactic leviathans—supermassive black holes believed to inhabit the centers of neighboring galaxies.
To understand how scientists were able to estimate Moby’s mass, let’s start by recalling what we can directly measure: the movement over time of stars within our own galaxy. We know this movement can be affected by a massive object in proximity to those stars. Somewhere in all this is also the other information we need in order to estimate Moby’s actual mass—not just in descriptive terms (“supermassive”) but in actual numbers. To uncover that information, we have to use math.
The math we use is Johannes Kepler's Third Law, which in our case relates the mass of Moby to the orbit of a star that is close to it. We can make use of this relationship because the mass of the star is so much less than the mass of Moby. We need to figure out (1) the time it takes the star to orbit Moby, and (2) the radius of that star's orbit around Moby.
To calculate (1), we track the path of a star near Moby across the night sky, and time how long it takes to move over that distance. Even a star close to Moby take a few years to complete a full orbit around Moby. Fortunately, we don't have to wait that long: we can track part of the star's orbit, then extrapolate to map out the full orbit. Then, we can figure out how much extra time it would take to complete that full orbit. To calculate (2), we simply measure the distance from the star to the galactic center, where Moby lies waiting with healthy appetite.
We then plug all of this information into the equation of Kepler’s Third Law to determine Moby's mass, which amazingly turns out to be as much as 4 million times that of our Sun. In fact, Moby has such a high mass that it makes the innermost stars whiz around it at speeds of millions of kilometers per hour. These observations of extreme motion under extreme gravity are even being used to test (and so far to substantiate) Einstein’s theory of general relativity---as I hope to discuss further in a future article.
But what about Moby’s relatives, other supermassive black holes in neighboring galaxies outside the Milky Way? As I mentioned before, we can’t presently zoom in enough to get precise measurements of how individual stars in a nearby galaxy orbit a prospective black hole.
Instead, we look at a selection of stars. Let's pick a selection in the innermost part of the galaxy, closest to the supermassive black hole. Although we cannot tell apart individual stars, we can measure collective properties of the stars in our selection. We start by measuring the average velocity of the selection.
Now compare the velocities of some of the stars in our selection, to that average velocity of the selection of stars as a whole. Let's take two cases. In the first case, some stars are traveling at a velocity much higher than the average, whilst some stars are moving with a velocity much lower than the average—think of popping popcorn, where some kernels fly up quickly, and others simply roll slowly sideways. In the second case, the differences in velocity are smaller. Think of peas simmering gently in a pot. The average velocity is the same in each of the two cases. However, there is more variation away from the average in the first case than the second case. Using technical language, we say the velocity dispersion is greater in the first case than the second. With careful analysis, we can quantify the velocity dispersion of our selected group of stars closest to the galactic center.
Repeat for a group of stars further away from the center, and then again, further away still. We can build up a map of velocity dispersion versus distance from the center of the galaxy. We can then cross-check what we are measuring against computer simulations which vary the mass of the black hole and other properties of the galaxy, until we find one simulation that gives us a best fit with the observed results. This then gives us our observed mass of the black hole.
Repeat for other galaxies, and we can slowly build up a database of black hole masses for different galaxies. Yet these observations are challenging to make, and limited to galaxies that are close to our own. It would be good to have a shortcut that we can use to more easily estimate the masses of black holes, including those in galaxies that are further away.
Fortunately, such a shortcut does exist. For the above galaxies, whose black hole masses we have already measured, now also measure the velocity dispersion of the “bulge” of the galaxy—the part whose stars are arranged in a ball as opposed to a thin disk. This is an easier measurement to make because we don’t have to try to zoom in on a tiny part of the galaxy—in fact, many of the largest galaxies are all bulge and no disk.
Plot black hole mass against velocity dispersion of the bulge, for each of those galaxies. In simplified form, we get something like this:
Relationship between black hole mass and velocity dispersion
As you can see, there is a relationship between black hole mass and velocity dispersion: as the former increases, so does the latter. So wherever the observed velocity dispersion happens to fall on the slope will correspond to a particular black hole mass—and so we know the approximate mass of the black hole in that galaxy.
Now that we have generated this graph, we can apply it as a shortcut to finding out black hole mass in other galaxies. For those other galaxies, we can just measure at the velocity dispersion of the bulge of the galaxy, which is much easier than laboriously mapping out the velocity dispersion of groups of stars versus distance from the center, and read off our graph what the corresponding black hole mass is estimated to be.
For reference, here's what such a graph actually looks like, in the professional journals in which astronomers publish. As in the simplified version above, the horizontal axis plots the velocity dispersion. The vertical axis plots the black hole mass, with a scale that goes from a million times the mass of our Sun to over ten billion times the mass of our Sun.
Plot of velocity dispersion versus black hole mass - Image Credit: The American Astronomical Society (2013)
Yet, the velocity-dispersion/black-hole-mass plot is really important even beyond assessing the masses of individual black holes, because it describes a direct relationship between the characteristics of the surrounding environment, far from the center of the galaxy, and the mass of a black hole at the very center of the galaxy. The relationship is surprising because, although supermassive black holes have enormous mass (and correspondingly strong gravitational pull), gravity tapers off quickly with distance (as we know from Kepler), so the intense gravitation of the supermassive black hole is felt across only a very small part of the galaxy as a whole.
Does this surprising relationship mean that a larger black hole in some way causes the velocity dispersion of stars in the central bulge to increase? Or, conversely, does the velocity dispersion in the central bulge somehow dictate the size of the central black hole? We don't know—it’s one of the mysteries still to be untangled. But it certainly seems possible this relationship is not a coincidence, and the growth of the galactic bulge and the growth of the supermassive black hole are connected in some as-yet-undiscovered way.
For now, however, we have at least our useful shortcut: we no longer need to be able to measure the movements of individual stars to be able to derive the mass of a black hole.
In the next article in this series, we'll look at a particularly exciting feature of some black holes: jets.
References
Herman Melville, Moby-Dick. A Norton Critical Edition. Parker, Hershel, and Harrison Hayford (eds). (2001). Second Edition, New York and London: W.W. Norton & Company.
Nicholas J. McConnell and Chung-Pei Ma, "Revisiting The Scaling Relations of Black Hole Masses and Host Galaxy Properties", Published 2013 February 5. The American Astronomical Society. The Astrophysical Journal, Volume 764, Number 2
Skidmore, W., TMT International Science Development Teams, & Science Advisory Committee, "TMT Detailed Science Case 2015", Research in Astronomy and Astrophysics, 15, 1945. DOI 10.1088/1674-4527/15/12/001. See also https://arxiv.org/abs/1505.01195
Acknowledgements
Many thanks to my colleagues Matthias Schöck (TMT System Scientist), Warren Skidmore (TMT Instrument System Scientist) and Nicholas McConnell (STEM Workforce Development and Program Manager at The Institute for Scientist & Engineer Educators), for helping with this blog entry.
Searching for Leviathan, Part 2: Where To Look, and How Old Is It?
Searching for Leviathan, Part 4: Active Galaxies and Jets